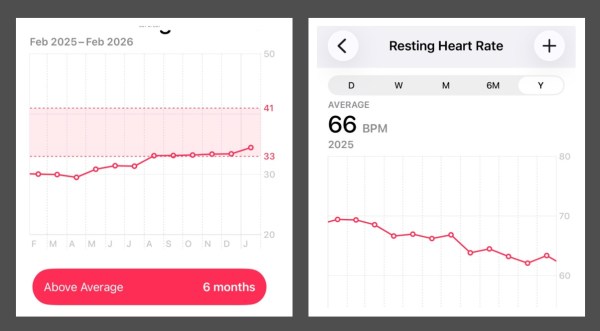
The first graph shows my VO₂ max climbing from “below average” to “above average,” and the second shows my resting heart rate dropping from around 70–72 down to about 59–63 — all in the last year. These two metrics matter because they’re basically snapshots of how well your body is handling life: VO₂ max reflects... Continue Reading →
Small changes matter